Using the Dashboard
The Dashboard pane provides information about your environment. Included in this pane are statistics about active and cumulative total jobs for your control node. The Dashboard page does not automatically refresh. The default refresh period is five minutes and can be reduced to as low as one minute. More resources are required to update the graphs more frequently, which can slow the system. If five-minute polling is selected, brief jobs may be missed and may not display on the graph at all.
You can select any item in a graph legend beneath the graph to hide or show that item on the graph. Click on the graph and scroll to zoom in or out on the graph and display a longer or shorter timeframe for every graph but Cumulative Totals and Active.
Short jobs may be missed with five-minute polling, if they begin and end between two polling intervals they may not display on the graphs at all.
All graphs in the Dashboard will dynamically change scale, depending on the numbers displayed. Check the left legend to identify the scale displayed. It can also change when one item on the graph is hidden.
Summary of Your Environment
On the right side of the pane you will see a summary list of current environment. This list includes the region, number of login instances, number of schedulers, and number of OrangeFS file systems. This summary does not include environments which have been deleted for this control node.
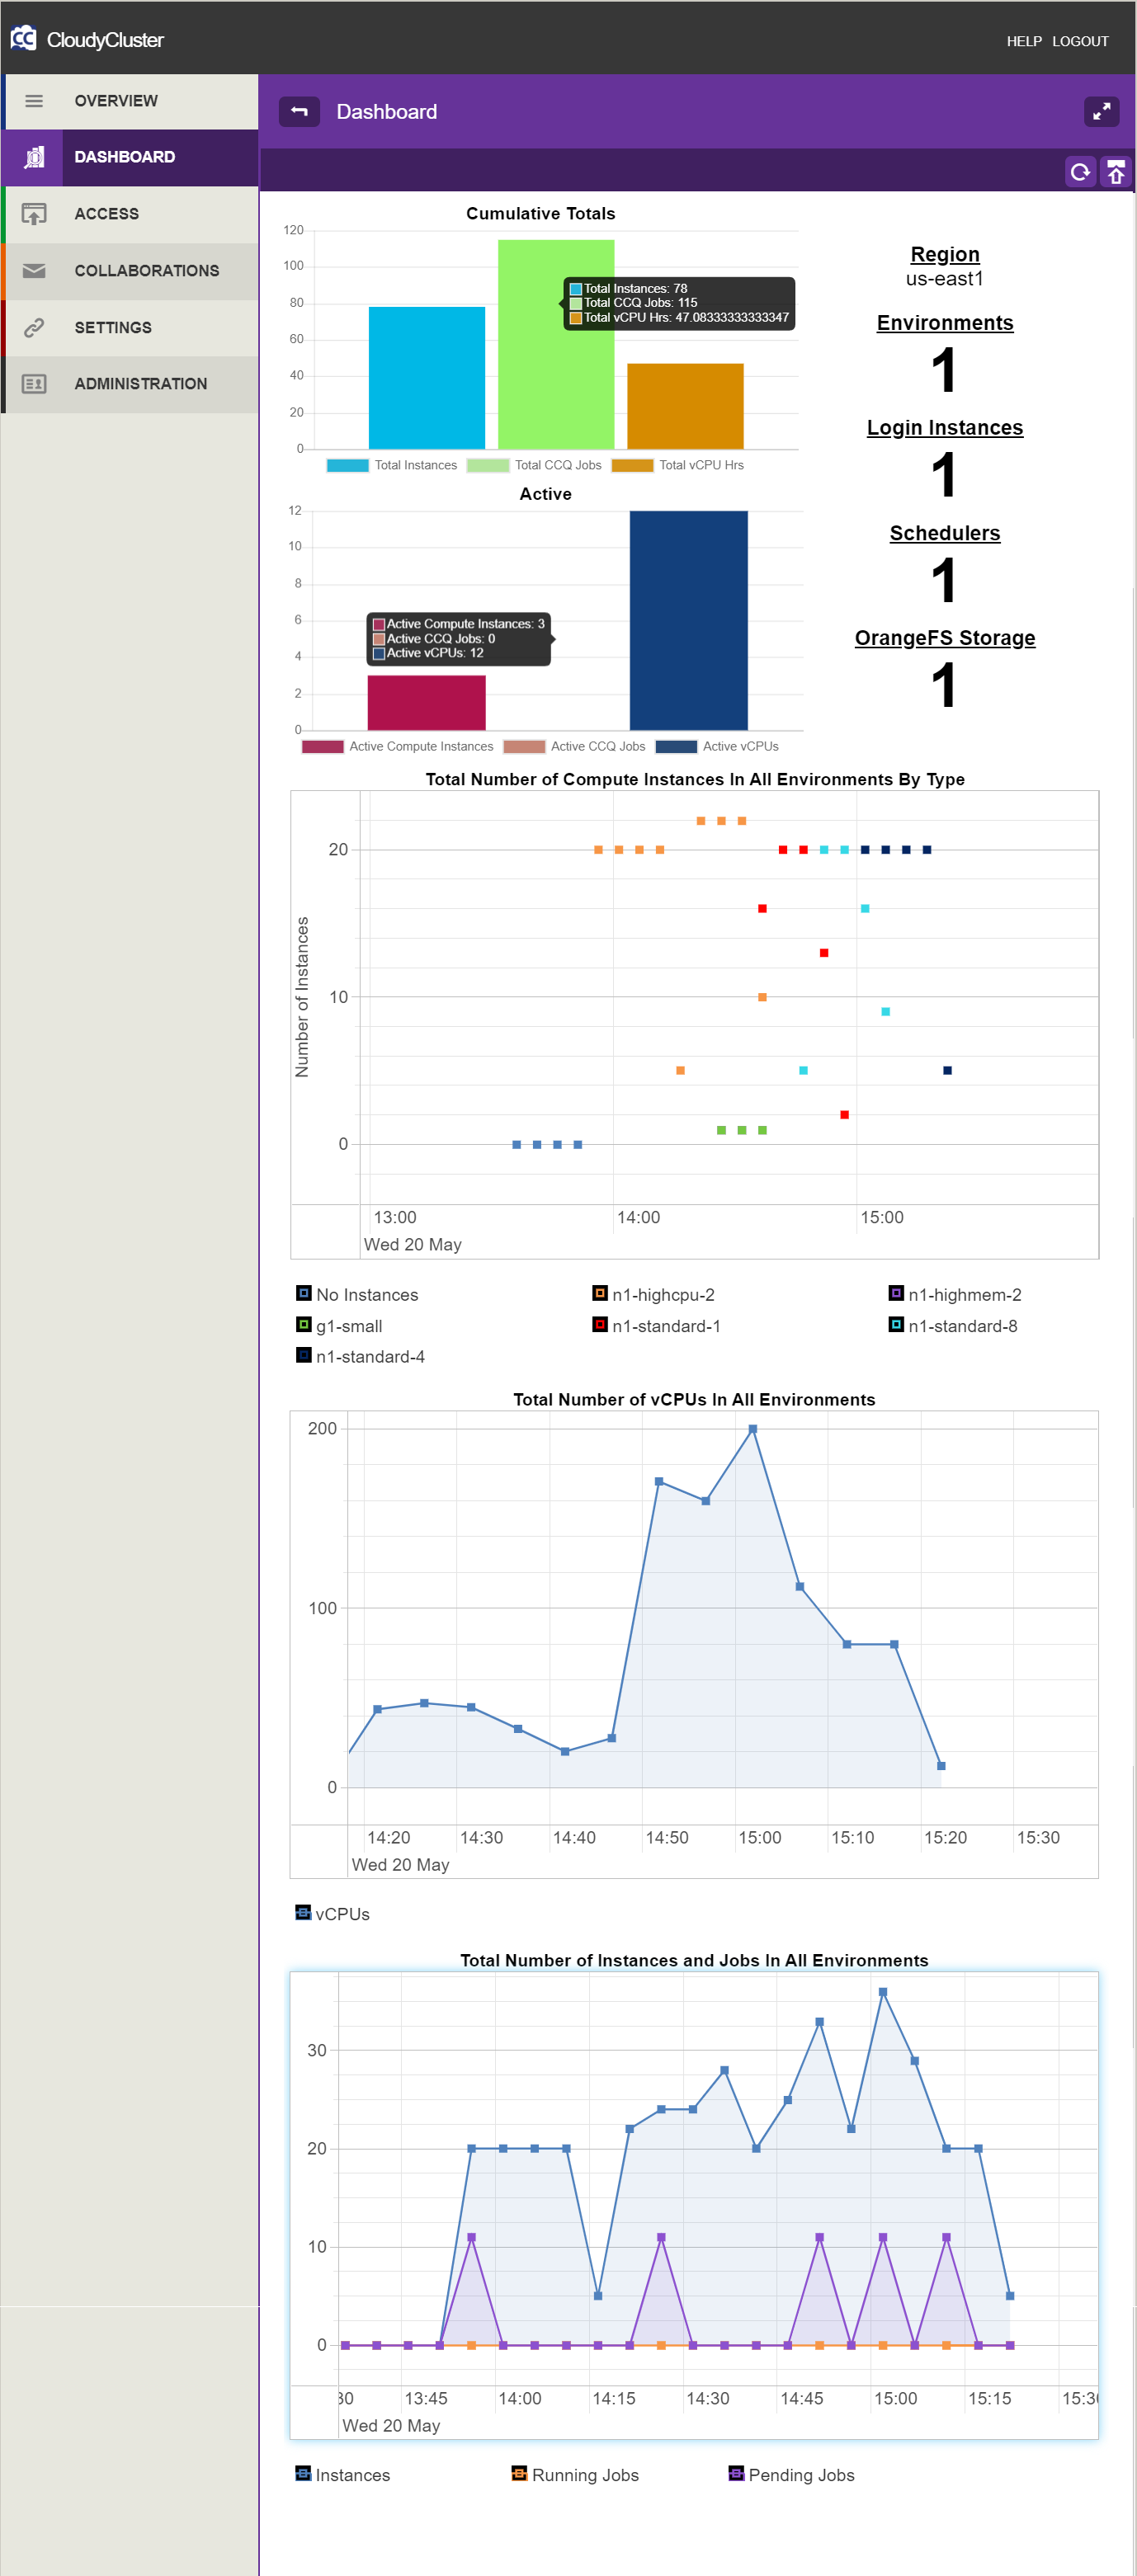
Information Charts
Most of the Dashboard, apart from the Current Summary column, contains data charts presenting a visual depiction of your control node statistics. These charts include the following:
Cumulative Totals
Cumulative Totals list the total counts since the inception of the Control Node, including environments that have been deleted.
- Total Instances refers to the combined total of all instances for all environments in this Control Node. Each instance of every type that has been used will count as one towards this total.
- Total CCQ jobs indicates the combined count of all CCQ jobs for all environments in this Control Node.
- Total vCPU Hrs indicates the combined total of all vCPU hours for all environments in this Control Node.
Active
Active refers to currently-running environments and excludes any existing instances or environments which are paused but are not deleted.
- Active Compute Instances is a count of all active compute instances at this time.
- Active CCQ jobs indicates the combined total of all active CCQ jobs at this time.
- Active vCPUs indicates the current number of active vCPUs for all environments active at this time.
Total Number of Compute Instances in All Environments by Type
This graph shows each type of compute instance as a separate line, over time.
Total Number of vCPUs in All Environments
This graph shows the total number of vCPUs currently running in all environments over time.
Total Number of Instances and Jobs in All Environments
This graph shows instance totals broken down into separate lines for instances, running jobs and pending jobs over time.
Total Number of Running and Scheduler Registered Instances in All Environments
This graph shows the total number of running instances and the total number of registered instances as separate lines over time.
Total Number of Registered Instances by Environment
This graph shows the total number of registered instances as a separate line for each environment over time.